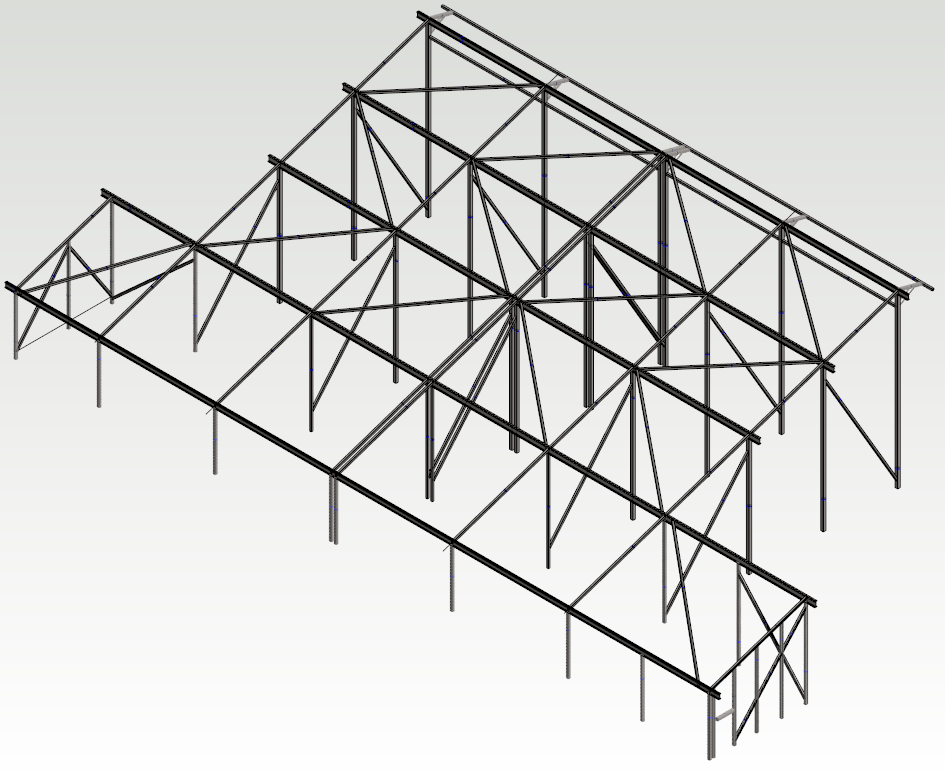
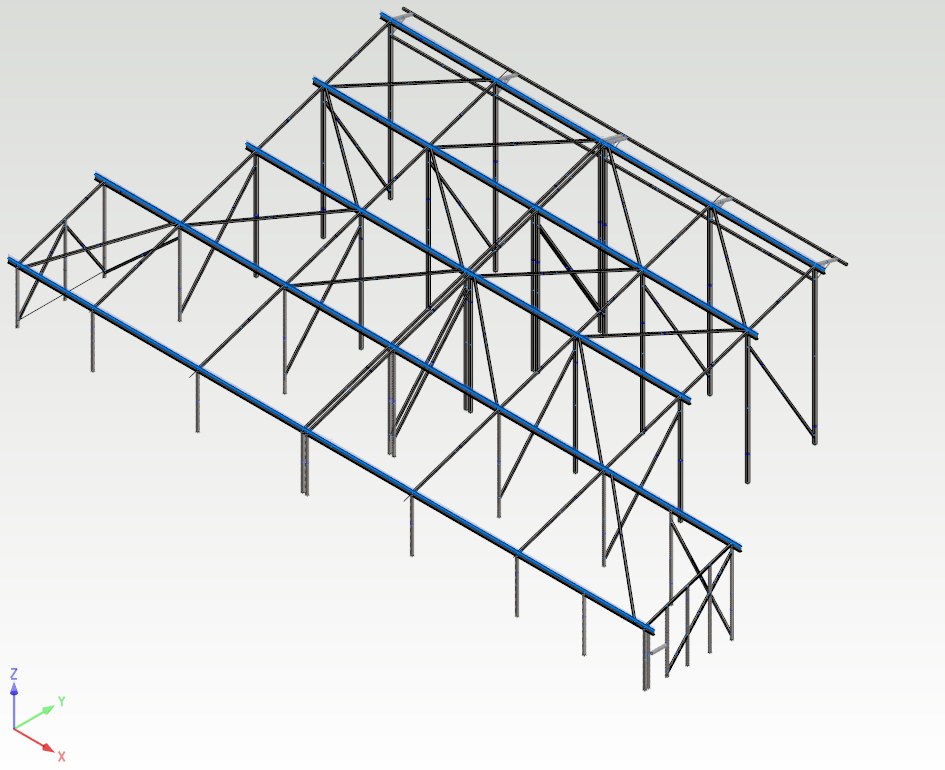
This example shows how to build a FEM analysis model for a steel structure illustrated in the figure below. The analysis model consists of beam elements. The bottom ends of studs will be fixed to the ground and I-beams are loaded with linear load. The self-weight of profiles is also taken into account.
Create a new study
-
Open model Ex_FEA_Beam_2 from project Examples. Go to FEA state by selecting FEA >

-
Select all parts of the model and create a new study by pressing

-
Fill study information. Set Self-weight of profiles selected.
Link nodes
-
Select all parts of the study by pressing Select parts from the contextual menu of the active study in study tree.
-
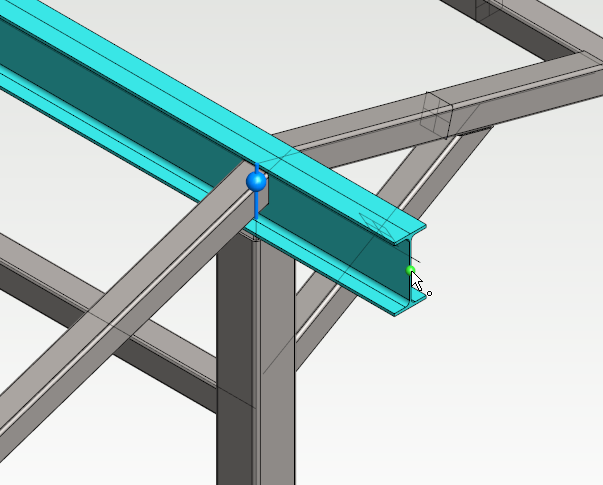
Link the nodes of selected parts by pressing

-
Set the tolerance to Automatic. The tolerance will be calculated automatically based on the cross sections of selected parts. Set the connection between nodes as

-
Check the automatically created links. Unlink badly linked nodes by selecting them and pressing

Set supports and loads
-
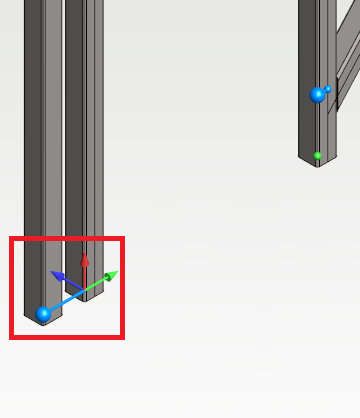
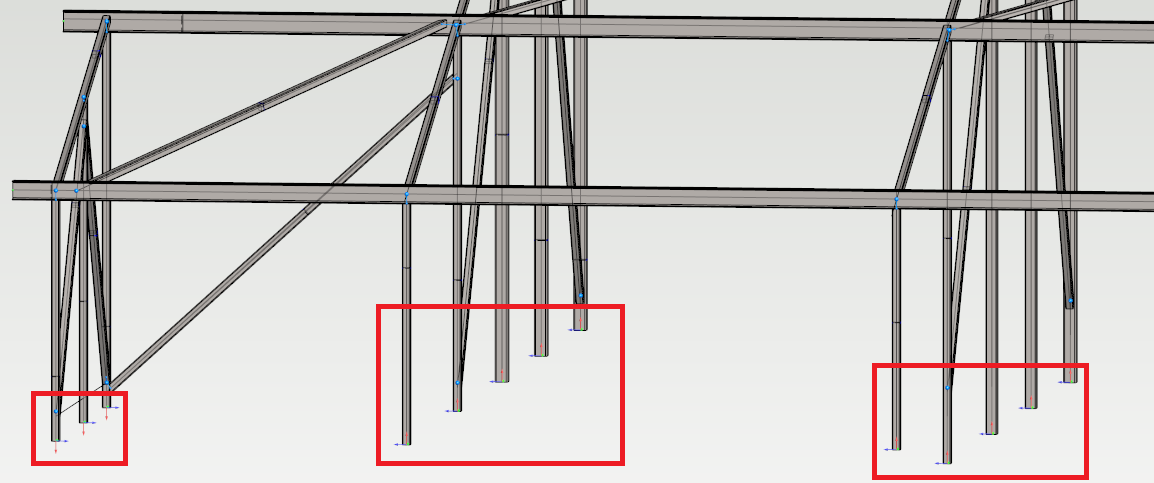
Select the bottom end nodes of studs. Set them supported by pressing

-
Start to add linear loads by selecting

-
Define the load by first selecting the end node of an I-beam and then the other end node of the beam.
Visible and selectable nodes can be filtered by selecting parts of active study. Only nodes belonging to selected parts are visible and selectable.
-
Add linear loads to the other I-beams in the same way as previous. In this example the values of linear loads are set to 8 kN/m in the negative Z direction of 3d model.
-
The analysis model is now ready for solving.
Solve the study
-
Select

-
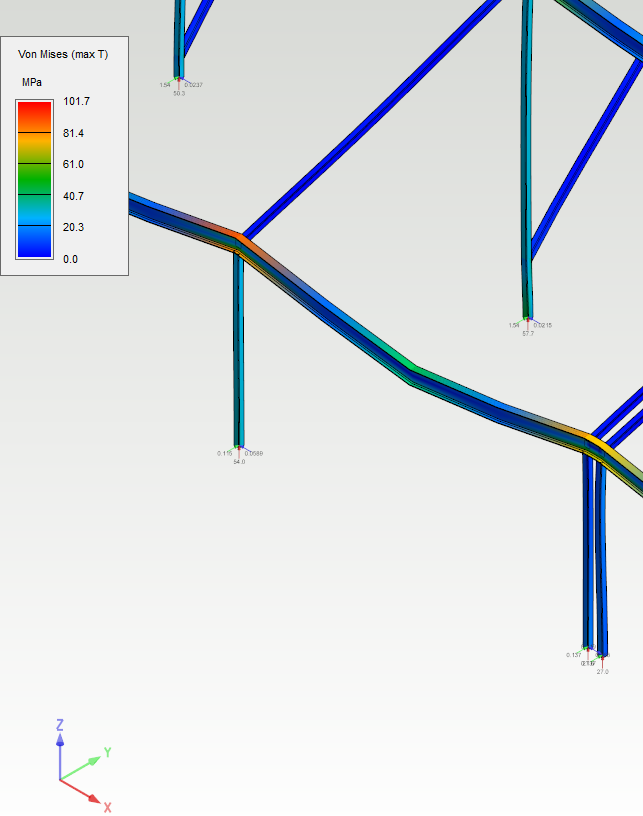
The stress plots of study members can be now examined. The results display can be selected as colored or diagram. The displacements of structure can be visualized by dragging Displacements slider. The support reactions of supported nodes are shown when Show support forces and Show support moments are selected.