
You can fetch data from Vertex Flow directly to Microsoft Power BI using Power BI's Flow connector. This article guides you how to get started with the connector.
Installing Power BI and enabling the Flow connector
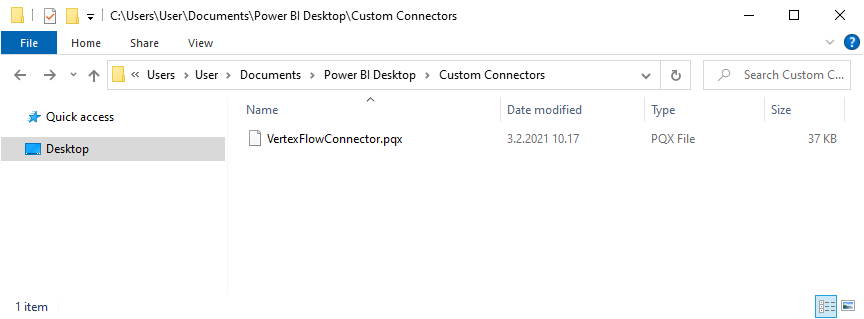
You can download and install the Power BI Desktop software for free from Microsoft's website or Microsoft Store. In order to install the Flow connector, locate the install directory for Power BI connectors, presumably located in the path C:\Users\<username>\Documents\Power BI Desktop\Custom Connectors. If the directory does not exist, create it. Download the file VertexFlowConnector.pqx from the link on the right and move it to the install directory Custom Connectors. The connector can be enabled in two ways related to the connector's certificate. See the options below:
Validating the connector's certificate
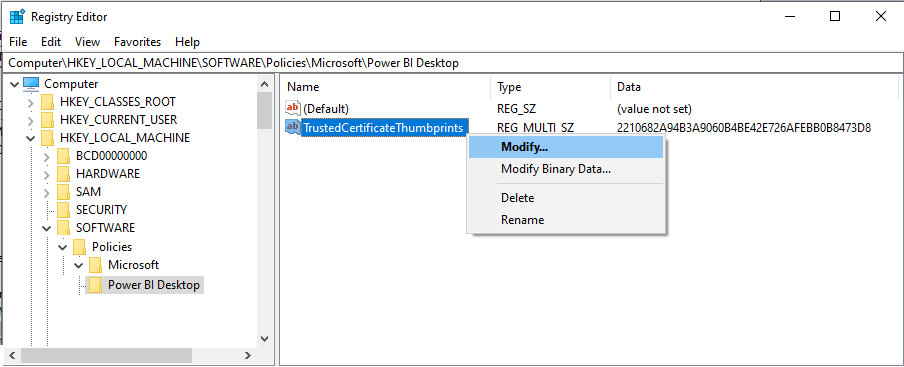
Power BI's Flow connector is certified using an SSL certificate of Vertex Systems Oy. To create a trusted connection, Power BI needs to be given the thumbprint of the certificate's digital signature. The thumbprint is written into the computer's registry using, for example, the Windows Registry Editor according to the instructions below. If your permissions do not allow modifying the registry, turn to the IT support person in charge of your computer.
Using the Registry Editor, go to the path HKEY_LOCAL_MACHINE\Software\Policies\Microsoft\Power BI Desktop and create a new variable of type “Multi-String Value” (REG_MULTI_SZ) with the name "TrustedCertificateThumbprints", if it does not already exist.
Add the thumbprint of the Flow connector (E763CEA755E93CC562B0CE168BD91CF58AAF2607) to the variable. If the variable already contains thumbprints of other connectors, separate the thumbprint with the separator "\0" or add the thumbprints to different rows by right-clicking the variable and selecting Modify.
When the thumbprint of the Flow connector has been saved in the registry and the Flow connector's file has been added to the Custom Connectors install directory, the Flow connector is available in Power BI.
You can also read Microsoft's documentation on this matter.
This process can also be automated with PowerShell, e.g. using the command below. Note that the following command assumes you have not installed other connectors, and will overwrite any previous trusted certificate thumbprints.
reg add "HKEY_LOCAL_MACHINE\SOFTWARE\Policies\Microsoft\Power BI Desktop" /v TrustedCertificateThumbprints /t REG_MULTI_SZ /d E763CEA755E93CC562B0CE168BD91CF58AAF2607
Using the connector without certification
If the certificate of the Flow connector is not validated, the use of extensions without validation needs to be allowed in Power BI's settings.
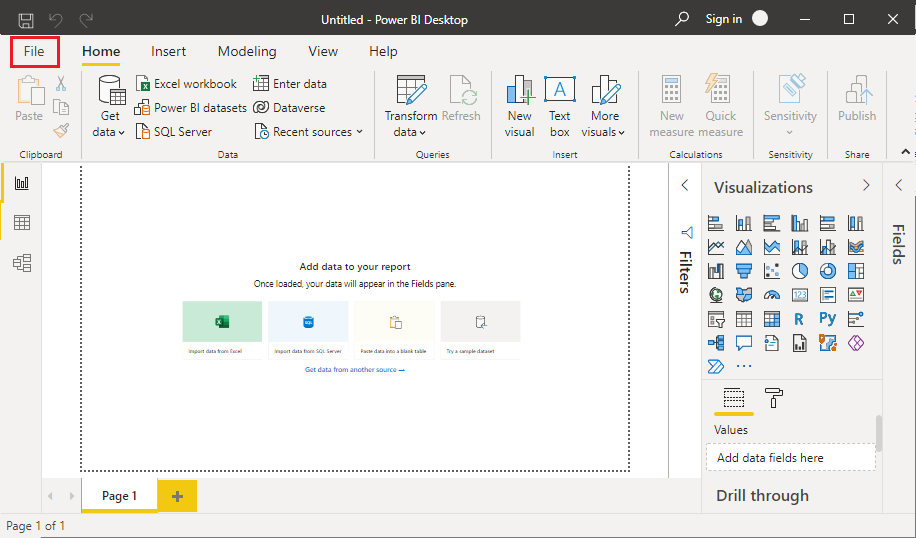
Open the File group in the ribbon.
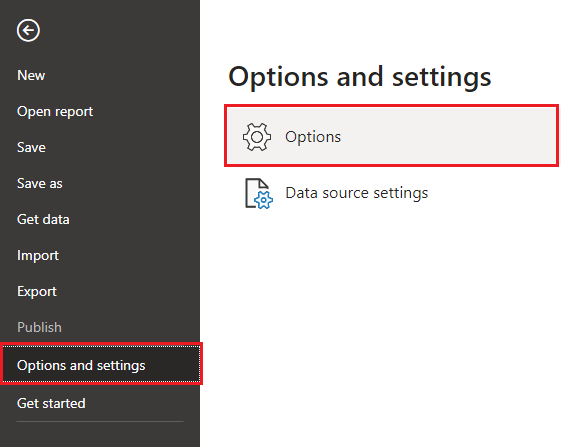
Go to the tab Options and settings and choose Options.
Go to the tab Security and to the section Data Extensions, then select the option Allow any extension to load without validation or warning.
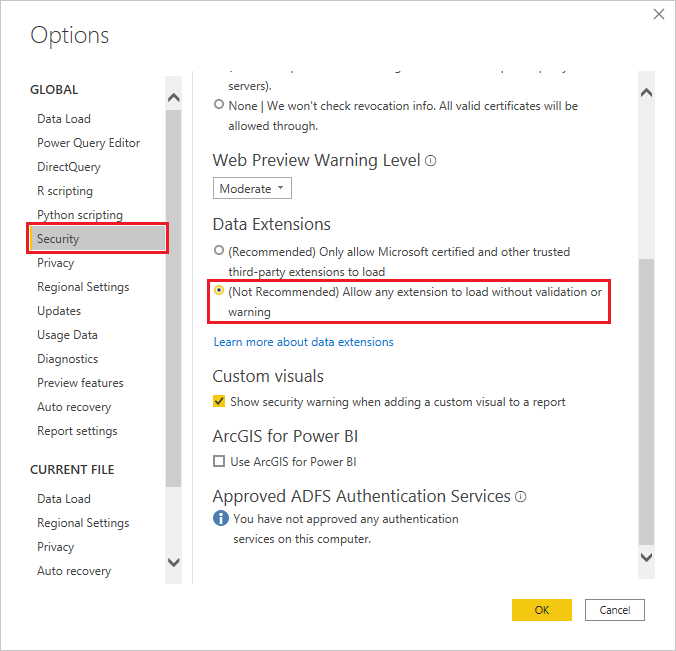
When the security setting for data extensions has been set as shown above and the Flow connector's file has been added to the Custom Connectors install directory, the Flow connector is available in Power BI.
Getting data from Flow
Using the connector
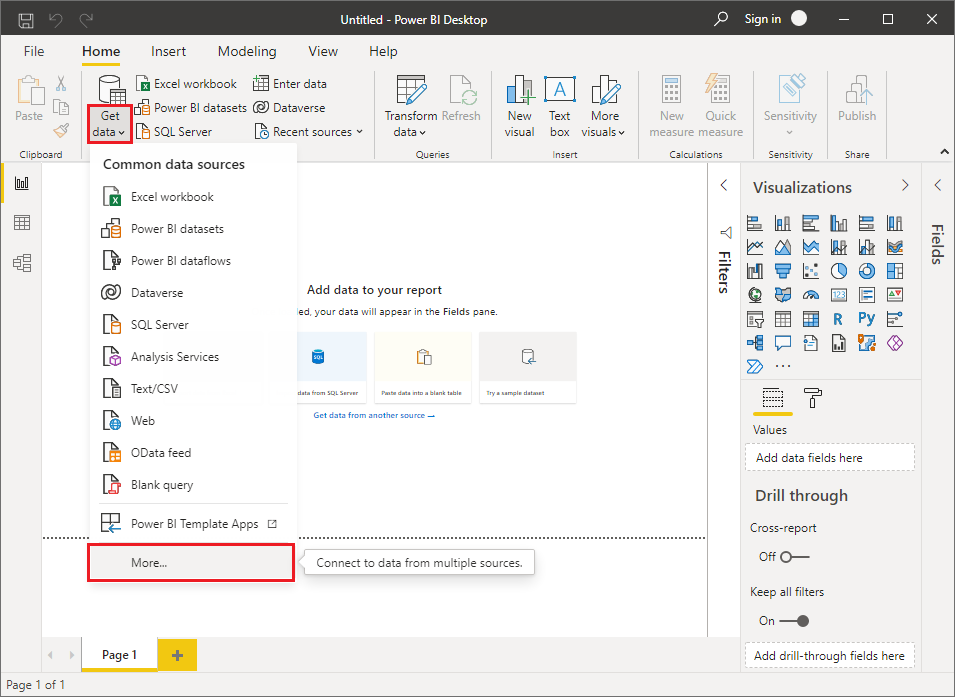
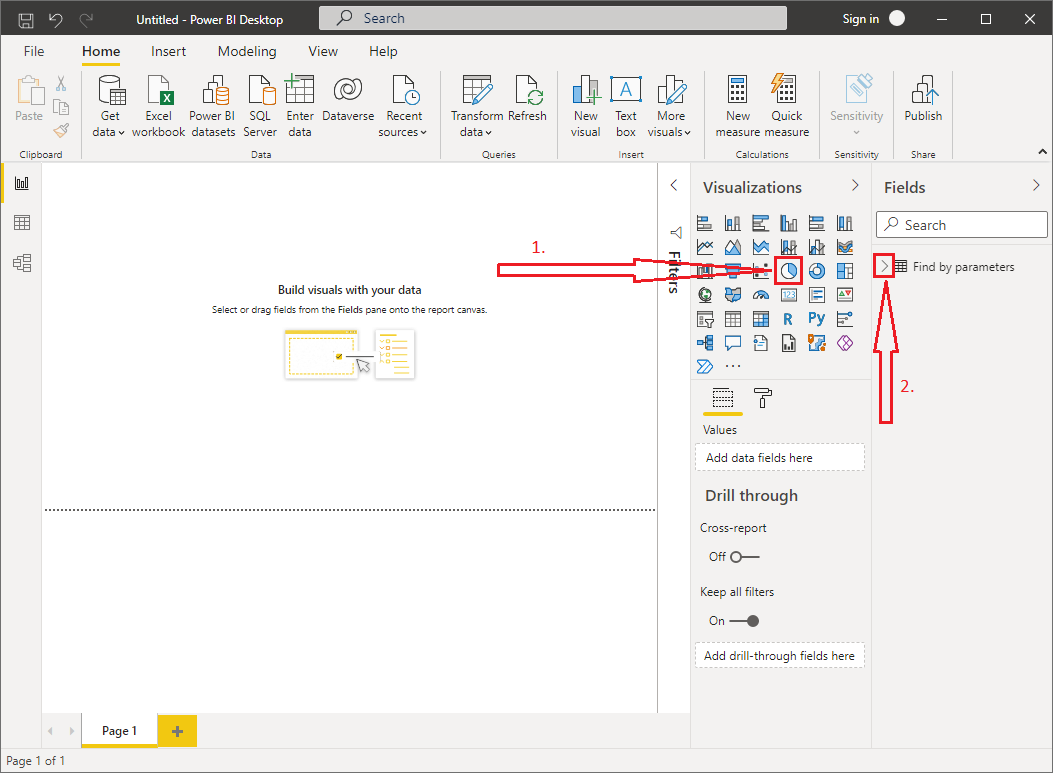
In Power BI, go to the Home tab in the ribbon and in the Data group, choose Get data and then More....
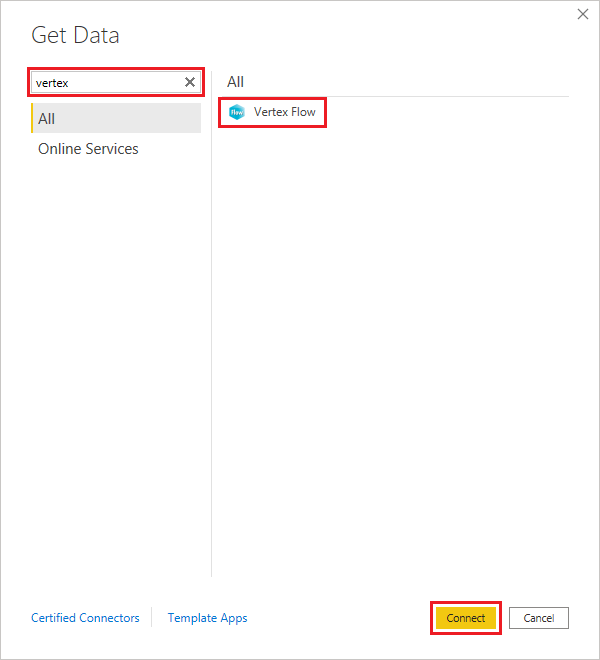
Find the Vertex Flow connector, for example by writing "vertex" in the search field. Choose Vertex Flow and select Connect.
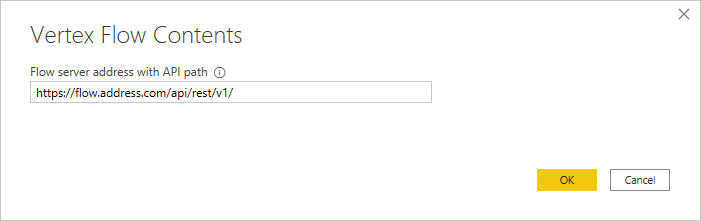
In the text field, write the address of the Flow server from which you want to get data. With Power BI's Vertex Flow connector you can direct your data queries to different Flow servers by changing the address in this field.
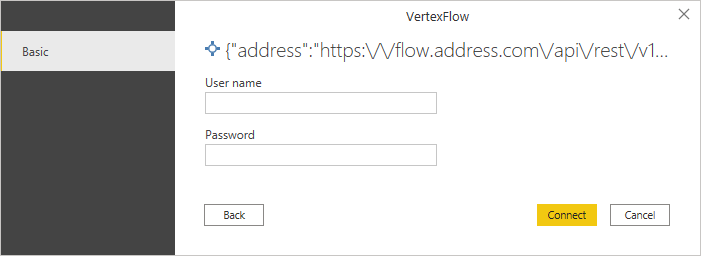
Sign in with your Flow credentials. The Power BI connector does not require special Flow credentials, but you can create an account on the Flow server just for reporting, if you wish.
After the first sign in Power BI automatically signs in to the Flow server with the credentials. The credentials are saved separately for each unique address of the Flow server, so you can sign in to different Flow servers with different credentials using the same Power BI connector.
-
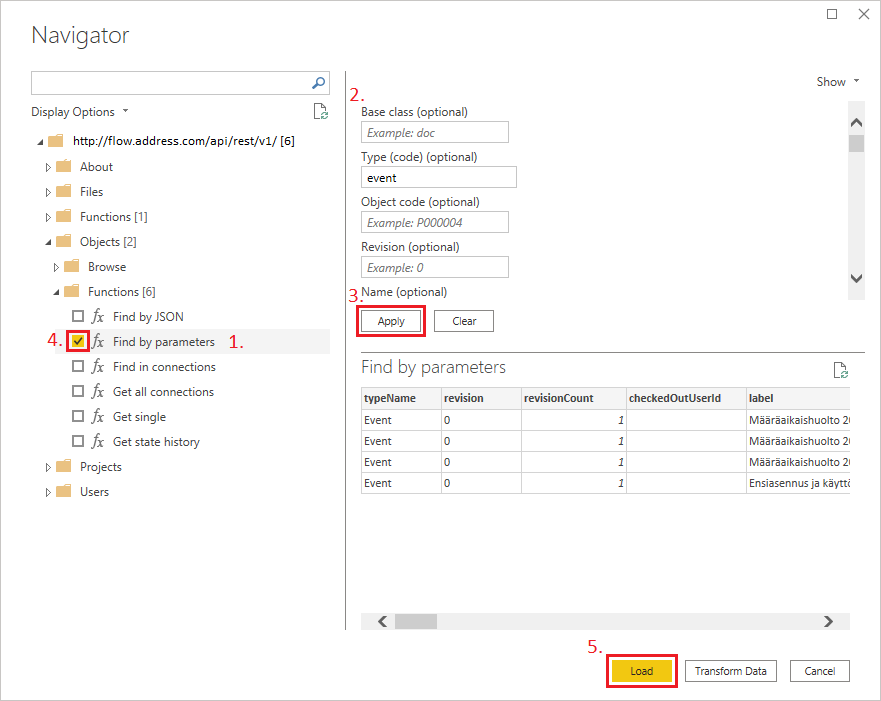
Select the operation you want.
-
Fill the input fields required by the operation.
-
Update the preview of the query using the Apply button.
-
Confirm the data query by selecting the checkbox of the operation. You can also select multiple operations.
-
Get the data using the Load button.
Processing the data
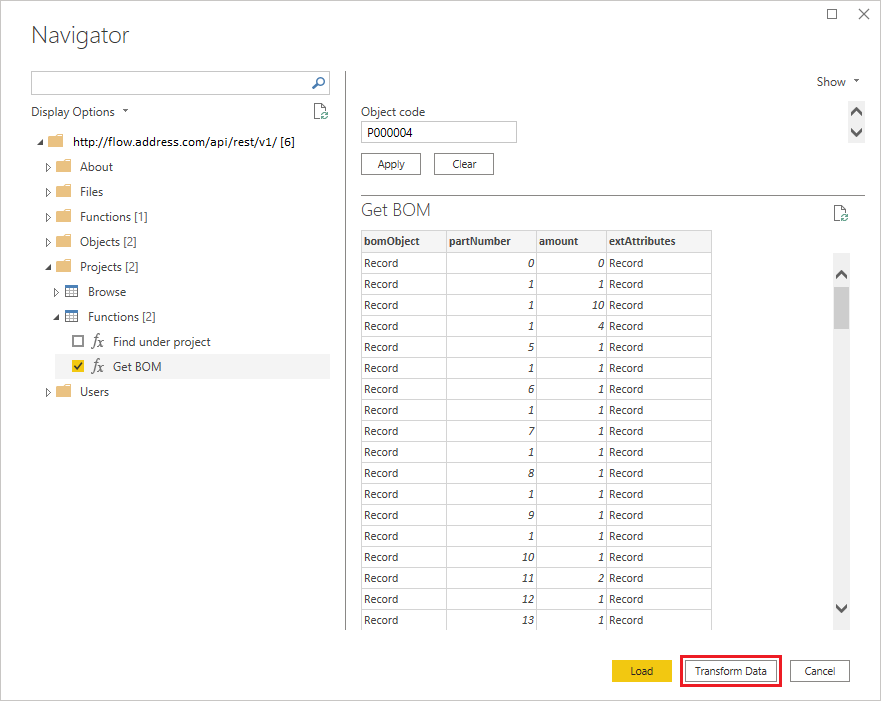
If there are unopened data structures, such as Record or List, in the data preview, you can open the data structures and get the data you want with Power BI's query editor by selecting Transform Data.
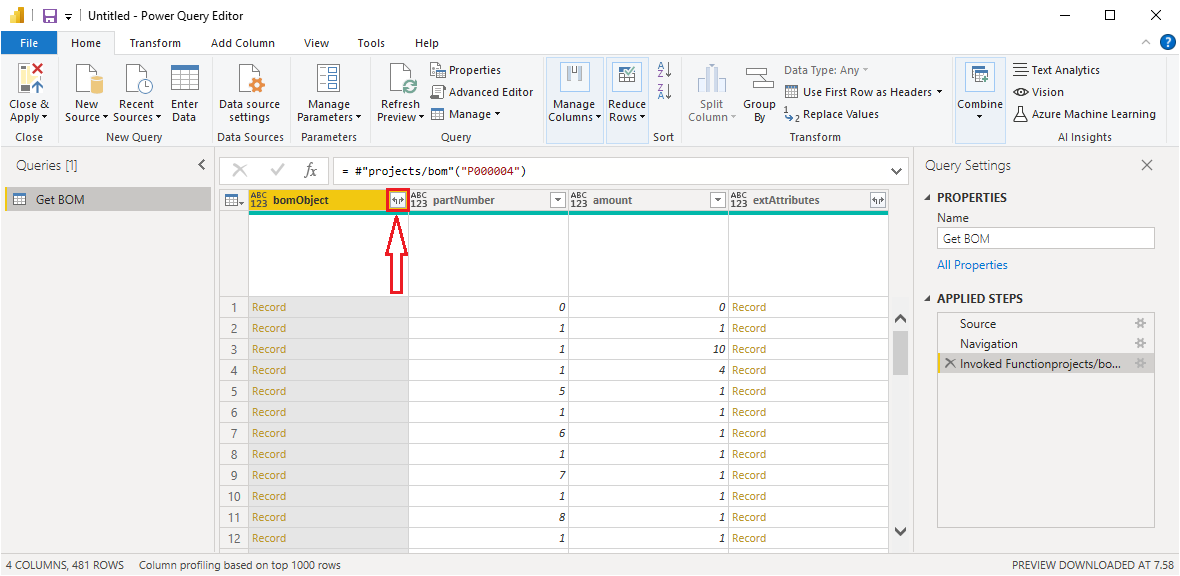
Press the column expand button indicated in the picture to view the sub-columns of the data column.
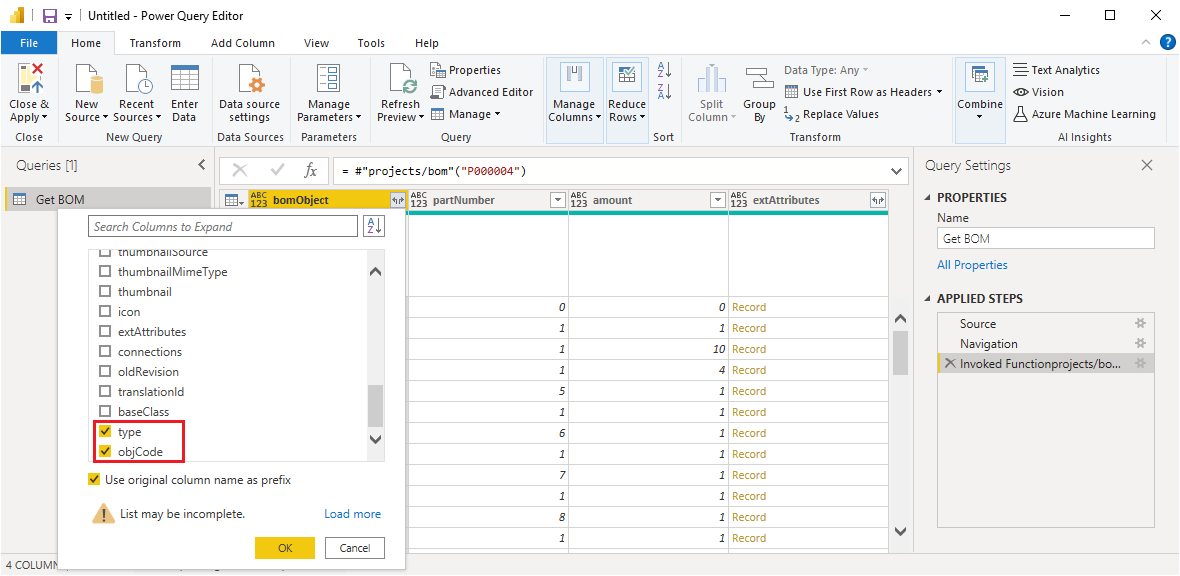
Select the columns you want from the list and press OK.
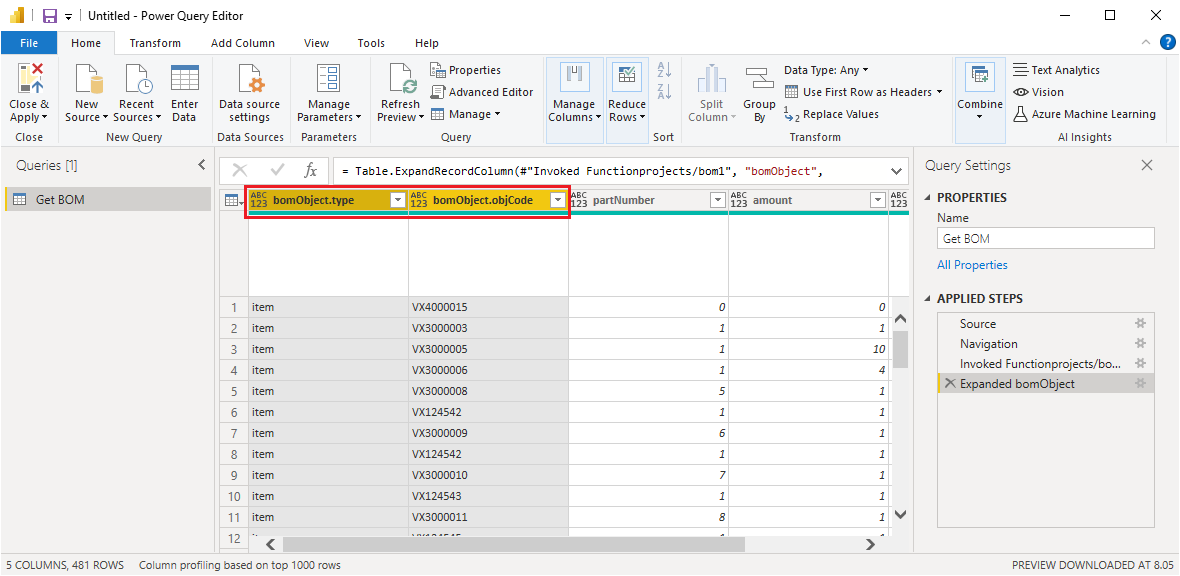
The original column is replaced with the chosen columns.
The numbering according to the Bill of Materials can be found in the PARTNO sub-column of the extAttributes column.
After the modifications are done, save the queries using the save icon in the top left corner or by using pressing Ctrl + S.
You can also create queries through the Flow connector directly in the Power Query Editor using the M script language. Using the M language you can create more versatile queries and process the data before creating a report. You can see examples of using the Flow connector via the M language by first making a query using the graphical interface and then opening the query in Power Query Editor's Advanced Editor (button in the Home tab's Query group).
Creating reports
This section introduces the basics of creating reports to get you started.
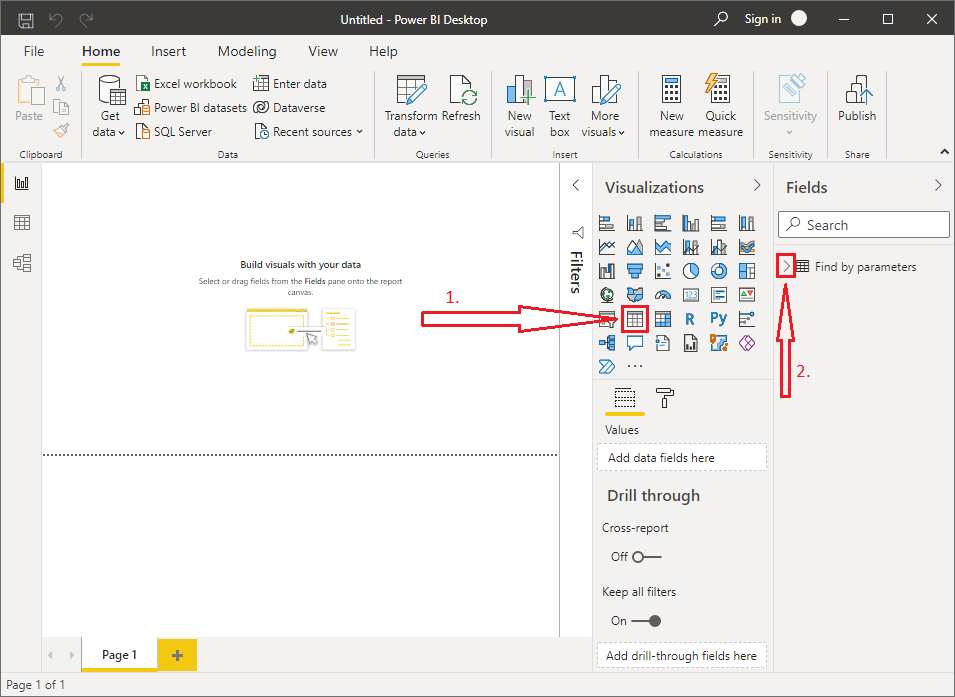
Table
-
Choose Table in the Visualizations section
-
Expand the query that contains the data which you want to visualize in the table
Choose the columns you want under the query. The columns will appear in the active table.
Pie chart
-
Choose Pie chart in the Visualizations section
-
Expand the query that contains the data which you want to visualize in the pie chart
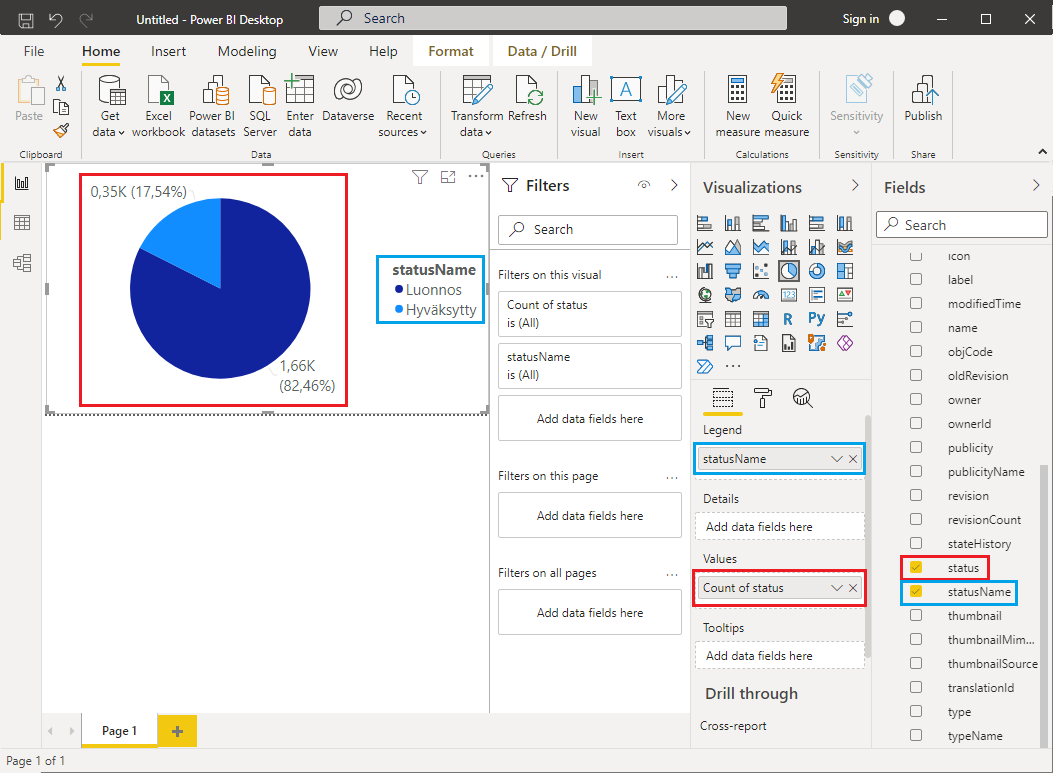
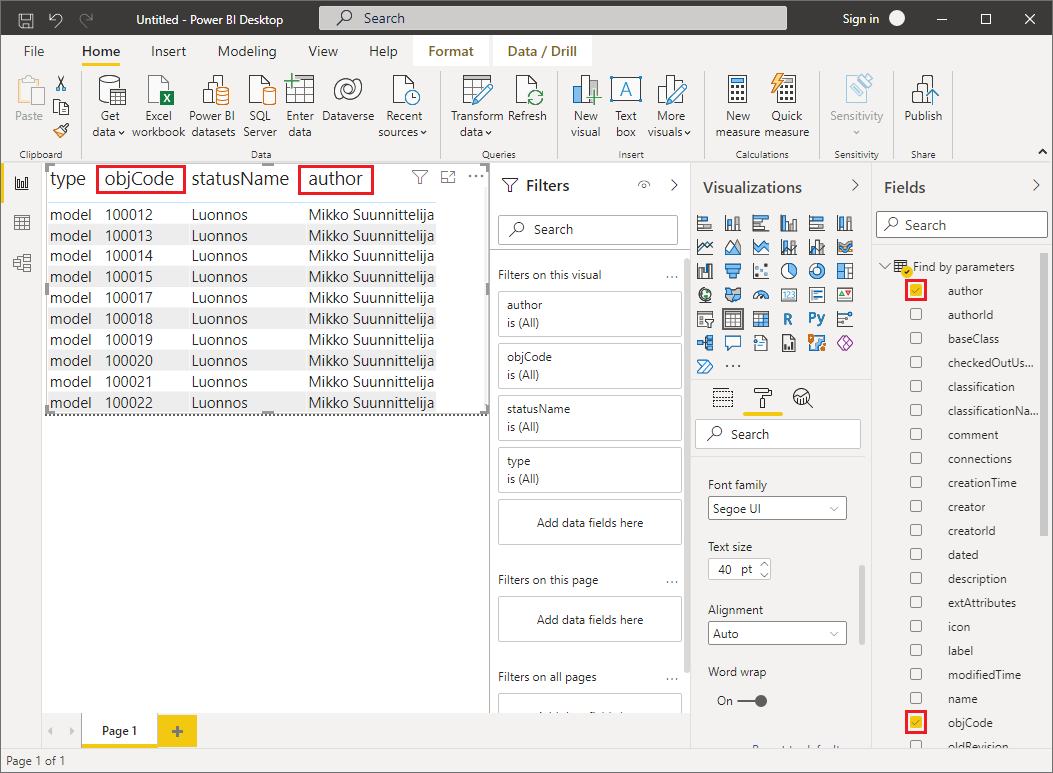
Find the column you want to visualize in the pie chart and drag it to the Values field of the visualization (both outlined in red in the picture). Then find the column you want to use for the legend of the pie chart and drag it to the Legend field of the visualization (both outlined in blue in the picture).
You could also drag the same column in both the Legend and Values field. In the example shown in the picture, the same end result could be reached by using the field statusName in both fields. If the field status were used, the pie chart's legend would show the raw data format of the objects' status, which can be a string of numbes for a customized state model. By using a separate column in the legend field, you can ensure that the visualization's legend is easily readable and understandable.
Creating an automatically updating report in the cloud using Power BI Service
This section will walk you through the basics of creating reports that automatically update their data at scheduled times from Vertex Flow using Power BI's cloud service, called Power BI Service.
In summary, the workflow is as follows:
-
Install the Vertex Flow connector
-
Create a report using the Power BI Desktop software
-
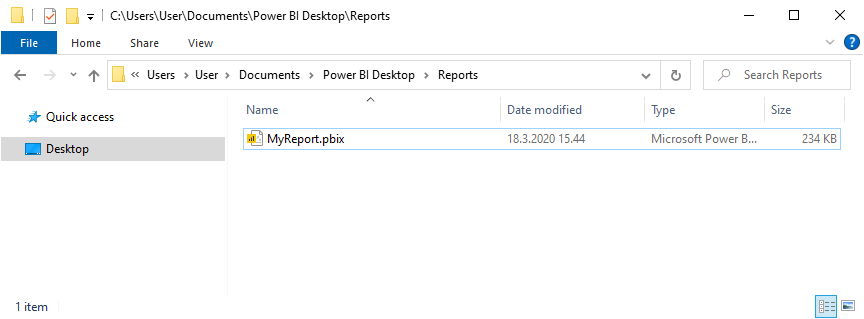
Save the report file (
.pbix) -
Sign in to Power BI Service using an Internet browser
-
Install the On-premises Data Gateway
-
Connect the On-premises Data Gateway to Power BI Service
-
Import the report file to Power BI Service
-
Publish the report
-
Schedule an automatic update for the report
Unlike the free Power BI Desktop, Power BI Service is a subscription based product. You can view Microsoft's pricing options for the service here. Some subscription level of Power BI may also be included if you have a Microsoft 365 subscription.
On-premises Data Gateway is a tool built by Microsoft for data transfer between on-premises data, such as databases on local hardware, and Microsoft's cloud services, such as Power BI Service. For more information, see Microsoft's documentation.
To automatically update reports that use the Vertex Flow connector, Power BI Service requires the On-premises Data Gateway to be installed on a local computer that has a connection to both Power BI Service and the Flow server. If Power BI Service cannot reach the computer with the gateway (e.g. the computer has been shut down), the report can not be updated. Thus, it is recommended to install the gateway on server hardware or another such computer that is always running, and preferably has a wired Internet connection.
Even if the Flow server you are using can be reached over the Internet (for example https://flow.yourcompany.com), instead of being by-definition an on-premises data source, Microsoft requires custom connectors such as the Vertex Flow connector to utilize the On-premises data gateway when connecting to Power BI Service.
Preparing the report
Install the Vertex Flow connector according to the Power BI Connector | PowerBIConnector install earlier in this article.
Create a report according to the Power BI Connector | PowerBIConnector report earlier in this article.
You may wish to include a Card visualization with the following code
= #table(type table[Refresh=datetime], {{DateTime.LocalNow()}})
or something similar to easily see when the report has been updated.
After creating a report in Power BI Desktop, save the report in the native Power BI report file type, as a .pbix file.
Sign in to Power BI Service using an Internet browser.
Setting up the On-premises Data Gateway
Install the On-premises Data Gateway on a computer that Power BI Service can reach reliably, following Microsoft's instructions.
The relevant steps for this use case are:
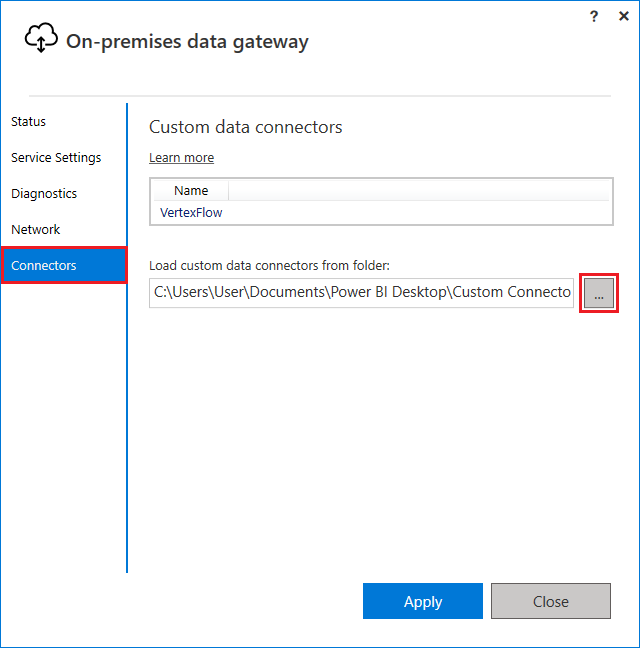
After completing the steps above, open the Connectors tab in On-premises Data Gateway and select the directory where the Vertex Flow connector is located. The Vertex Flow connector should appear in the list on the Connectors tab.
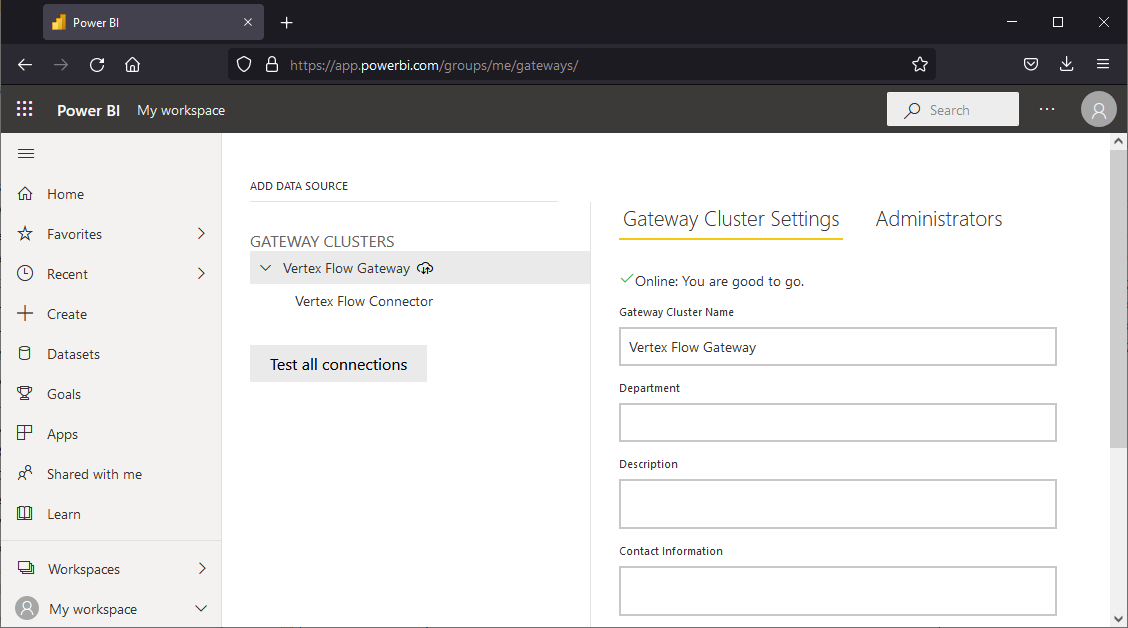
In Power BI Service, enable the use of the connector through the gateway, following Microsoft's instructions.
Publishing the report on Power BI Service
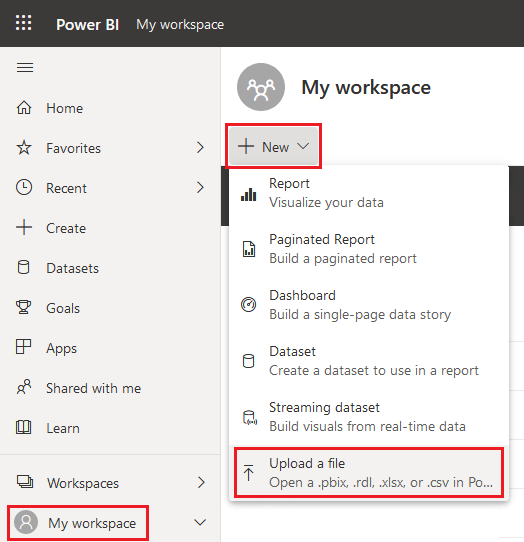
In Power BI Service, go to My workspace, then select New and Upload a file. Select your report .pbix file. Your workspace should now have three new items:
-
Report
-
Dataset
-
Dashboard
The report is by default visible only in your workspace. You can share it with your coworkers on Power BI Service by following Microsoft's instructions.
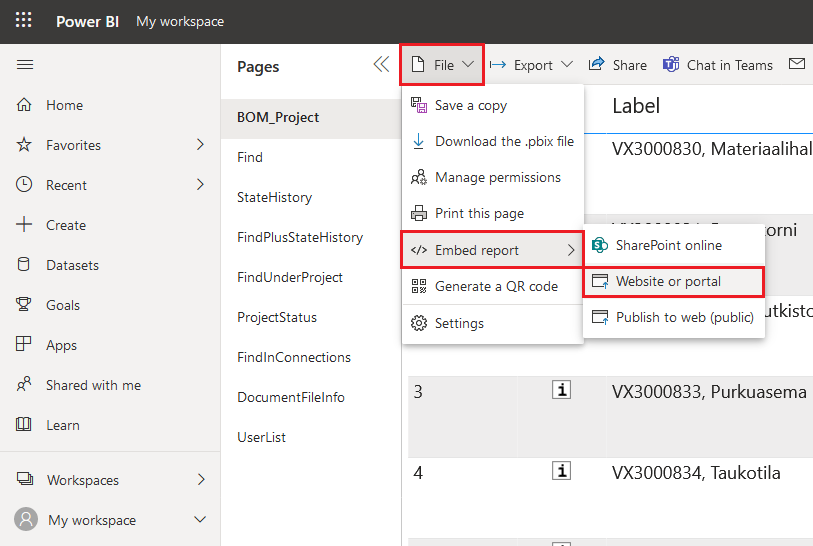
You can also embed the report as an interactive HTML element directly on a webpage or an intranet service. To obtain the HTML <iframe> snippet, open your report, and select File > Embed report > Website or portal. The embedded report can only be read by people you have shared the report with, and viewing the embedded report requires your browser to be signed in to Power BI Service.
Scheduling the automatic updates
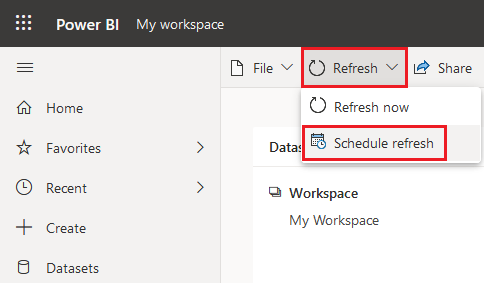
To schedule an automatic update for your report, select the dataset related to your report, and select Refresh > Schedule refresh. Follow Microsoft's instructions and set the refresh to use the gateway you set up earlier.
The actual refresh time of the report will likely differ slightly from the scheduled time and vary from refresh to refresh.