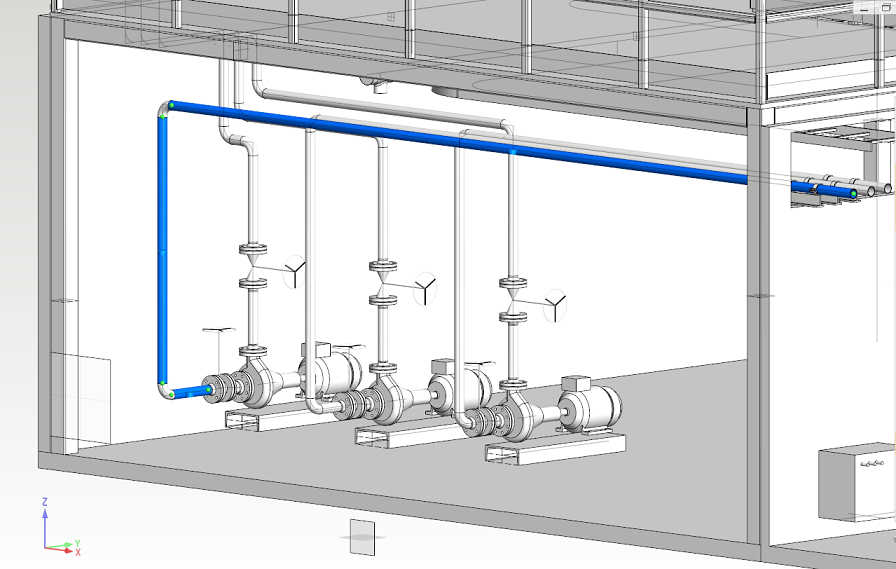
This example shows how to build a FEM analysis model for a pipe line. The pipe line is loaded by its self-weight, by the content weight of pipes and by a temperature load.
Create a new study
-
Open model VXPLA-MainAssembly from project EXP-Plant. Go to FEA state by selecting FEA >

-
Select the assembly Water-IN-1 and create a new study by pressing

-
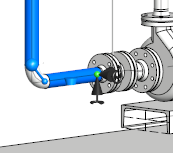
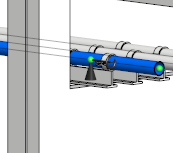
Only the straight pipes are valid sources for beam elements so the pipe elbows are excluded from the analysis. The welded connection between pipe and elbow can be modeled by a fixed connection between the end nodes of connecting pipes.
Link nodes
-
Select all parts of the study by pressing Select parts from the contextual menu of the active study in study tree.
-
Link the nodes of selected parts by pressing

-
Set the tolerance to Manual and 110 mm because the distance between pipe ends is approximately 108 mm. Now the pipe end nodes will be linked between each other. Set the connection between nodes as


Set supports
-
Set the end node of the pipe next to a flange supported by selecting it and pressing

-
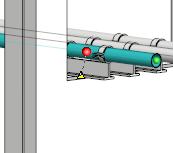
Insert node to a pipe line by selecting the pipe and pressing

-
Set support for the inserted node. Fix the translational degree of freedom in Y direction. Fix also the rotational degree of freedom in X direction. This assumes that the pipe is not free to rotate about its axis at the support. Check that the Local Coordinate System is selected for the node.
Set loads
-
Add content weight as load for all members of the study. Select all parts of the study and press

-
Set the content weight on by pressing Use checkbox from the Content wight branch. By default, the content density is the density of water. The default value for inner area is calculated from the geometry of 3d model. The inner area and content density can be overwritten by user.
-
Set the temperature load by selecting

-
The analysis model is now ready for solving.

Solve the study
-
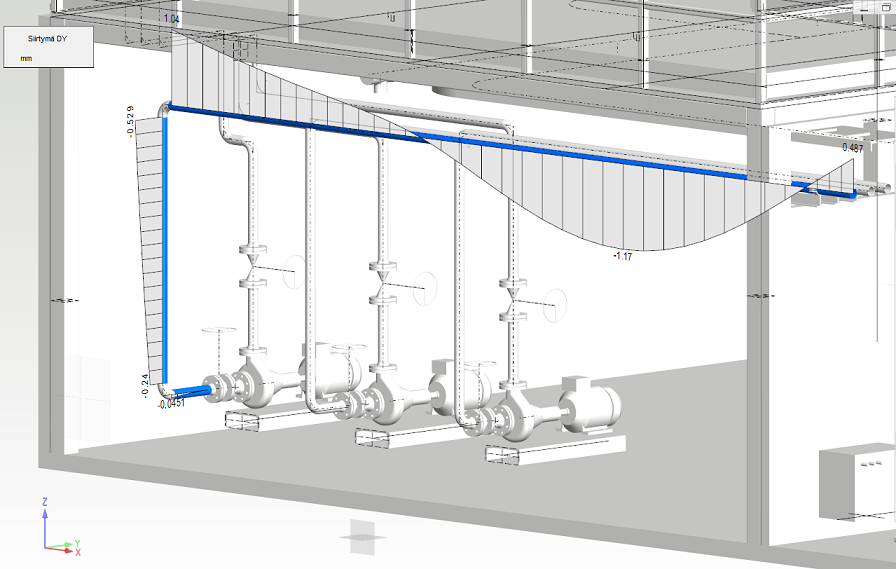
Select

-
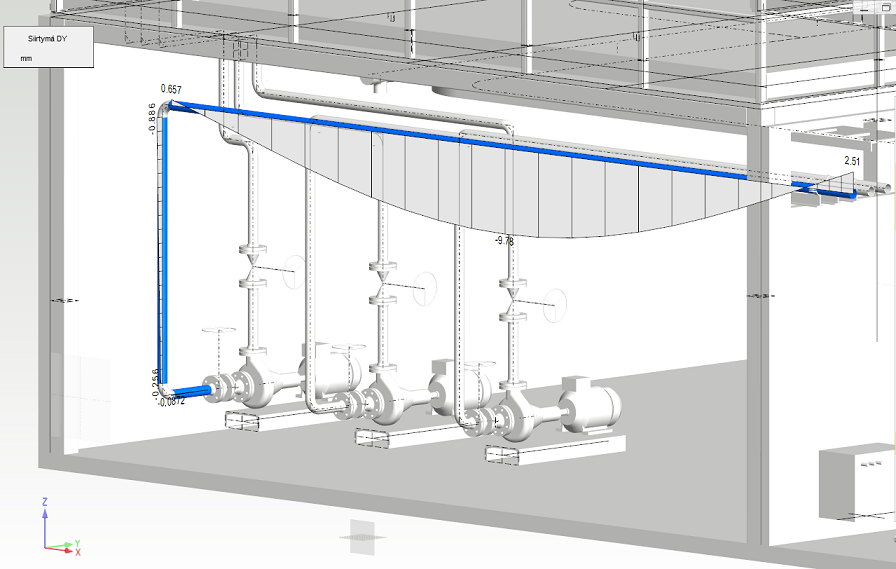
Examine how the displacement is changing when an extra support is added. Quit the FEA Results dialog and insert node in the middle point of the longest pipe. Set support to it and solve the study.

-
From the diagram can be read that the maximum displacement is now only approximately 1 mm.