


These reforms are presented in the Vertex Cad major version 26.0.00 (Vertex 2020)
Highlight, dim or color different structures in model drawings
This feature applies only to Vertex G4 and G4 Plant and G4 InD products
Use cases
Sometimes it is necessary to highlight a sub-assembly or an individual part in a drawing and / or to fade out some sub-assemblies or otherwise just to visualize different objects differently.
Examples of use cases:
-
Lay-out design where new objects can be highlighted and areas to be demolished can be "half hidden".
-
Representation of reference geometry surrounding a device.
-
Visualization of "contract boundaries" of a lay-out plan.
-
Color highlighting of various lines (for example pipelines).
Select the geometry you want to edit in the model or drawing
If you select the geometry in a model, all drawings in the model are drawn with the given parameters
-
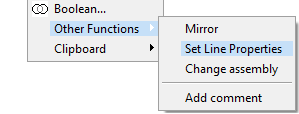
Select the parts or sub-assemblies and then the contextual function: Other Functions> Set Line Properties.
If you select parts and sub-assemblies in the drawing's feature tree, the geometry is drawn with new parameters only in this drawing.
-
You cannot assign custom line parameters to an individual projection of a drawing.
Select new drawing properties for the geometry
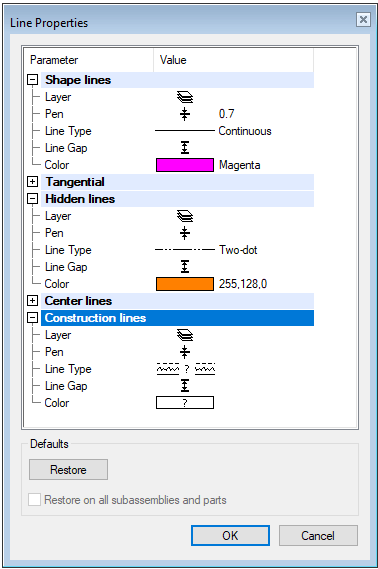
You can customize the drawing of the following line types:
-
Shape lines
-
Silhouette lines (for example pipe lines) are drawn as shape lines.
-
-
Tangential lines (contours of planar surfaces and other surfaces (including cylindrical and conical surfaces) when the surfaces meet tangentially.)
-
Hidden lines
-
Center lines
-
Construction lines (Guide lines)
You can choose following properties from the list:
-
Layer
-
Pen width (Pen)
-
Line type
-
Two-Dimensional Line Width (= Line Gap). This does not affect a one-dimensional line. Not if you use the Fast Drawing of Dashed Lines option.
-
Color: You can choose the Color from three different color palettes or five "basic colors".
Local coordinates
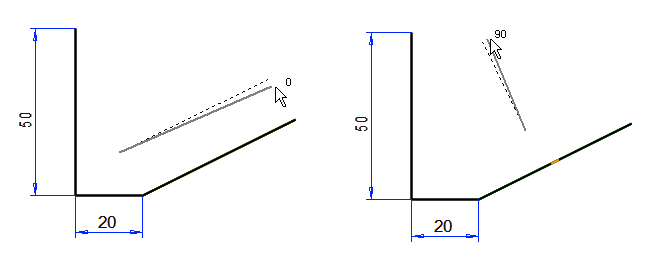
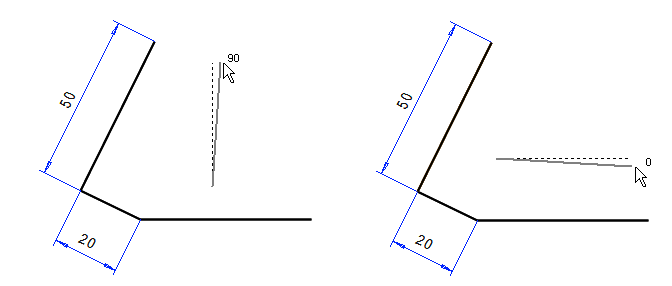
More informative cursor
The cursor displays the direction locks more informatively than before. There are now symbols x,y,z if direction is parallel to the main coordinate axes. It shows also angles in 45° steps: 45°, 135°, 225° and 315°.

Use local coordinates for drawing angled objects
Now you can quickly access the local coordinates in the menu opened from the tool strip.
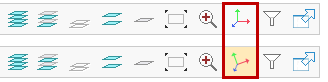
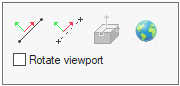
The button opens the menu:
-
You can select a line as the horizontal direction (left button).
-
or two points (the second button from the left).
-
Return to the global coordinate system ("globe" button on the right).
If you select Rotate viewpoint, the drawing will rotate to 0 ° horizontally. (The default directions for the dimension line are always parallel to the global coordinate system).
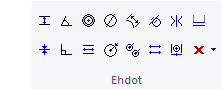
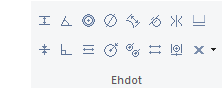
The constraints buttons follow the activity of the 2D constraint manager
The buttons in the Constraints group are passive (gray) if the 2D constraint manager is disabled. This helps the user to know if the constraints are available or not.
-
2D constraint manager is used:
-
2D constraint manager is not used:
Remember that you can switch the 2D constraint manager on or off here: File> User Preferences> Drawings, Models> Usage> 2D Constraint Manager.
For a pure 2D drawing, we do not recommend using the 2D constraint manager in most cases. For model drawings, we recommend using them.
Dimensions
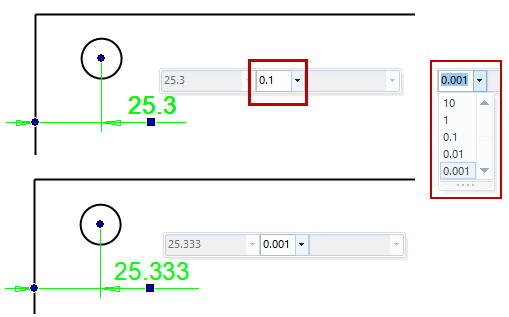
Quickly change the dimension precision
Changing the precision of a single dimension is now easy to do with the mini toolbar.
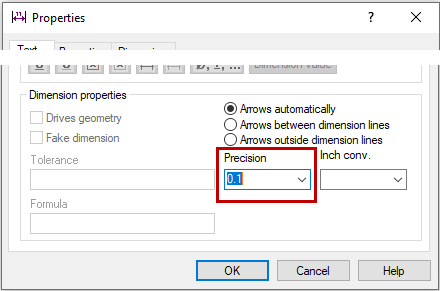
You can adjust the precision of multiple dimensions in the Properties dialog box.
-
First select the dimensions and then the contextual function Properties.
Continuous baseline dimensions
The functionality of continuous baseline dimensions has been improved. The dimension line remains in place even when the object to be dimensioned is moved. This applies mainly to 2D drawings.
Continuous baseline dimensions retain intelligence in copying
Object copying has been improved so that the dimension retains its properties if copied with dimensioned objects.
General
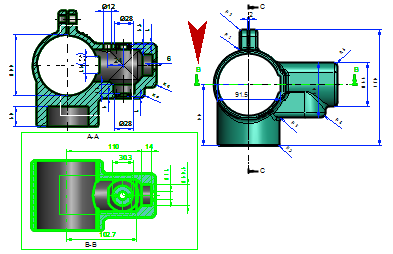
Cutting line will be highlighted when the cutting view has been chosen
-
You can easily see which projection the cut was made of by activating the cut projection.
-
If you select a projection in the feature tree, the line will appear normal (not dimmed).
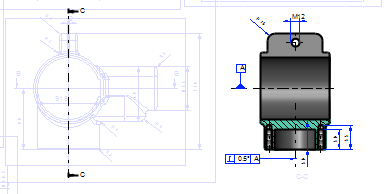
Detail view boundary lines will be highlighted when the detail view has been chosen
-
You can easily see which projection the detail view was made of by activating the detail view projection.
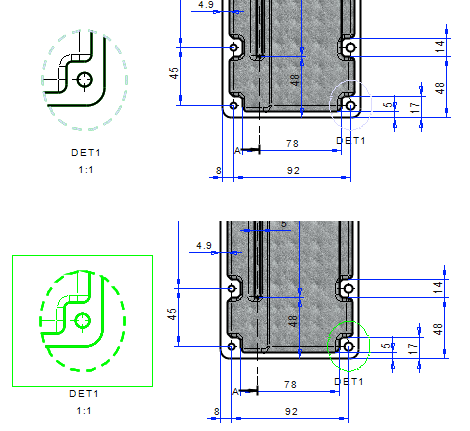
Unfortunately, the detail view projection activated in the drawing's feature tree cannot color the boundaries of the detail view.
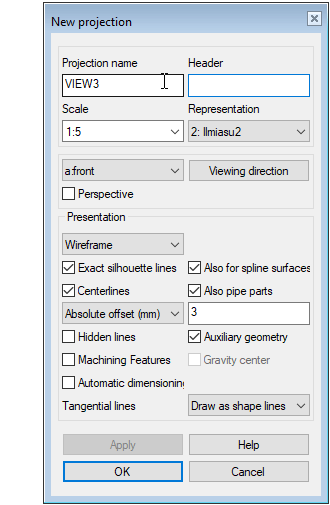
Enter a header for a projection already when creating it
When you add a new projection to a drawing using the Projection function, you can immediately enter a header for the projection, if necessary.
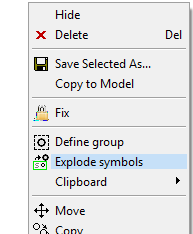
Extract several symbols at once into groups
You can explode multiple drawing symbols at once using the contextual function Explode Symbols.
-
The function is available when you have selected two or more symbols.
Group explode does not request confirmation
The function Group> Explode group selected from the ribbon bar no longer asks for confirmation, so exploding groups is fast.
-
You can of course cancel the exploding with the Undo function.
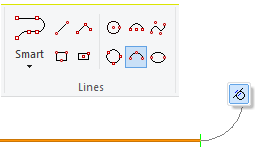
Tangential arc has been removed as an unnecessary function
The function tangential arc has been removed from the user interface
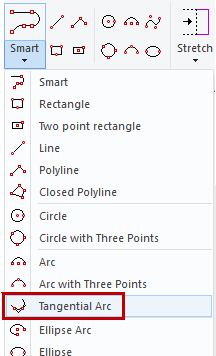
Instead, use the Arc function (three perimeter points) and its mini menu to determine whether you are drawing the arc tangentially or not.
Rasters and Z-coordinate of elements
Raster image properties have their own tab
The Properties tab of raster images is activated when you select a raster image. (Not when adding, like with other elements).
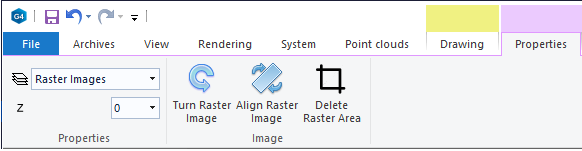
Use the tab to control the raster image's:
-
Layer
-
Z-coordinate.
-
You can rotate the raster 90 ° counterclockwise.
-
You can make the raster horizontal by pointing two points.
-
You can clear the area by folding.
The drawing order of raster images is defined by the Z coordinate
The value of the Z coordinate replaces the old raster function Set Raster on Top. It is now removed from the Raster Images drop-down menu.
-
A larger Z coordinate raster covers a smaller Z coordinate raster.
Elements now have a Z coordinate
Now you can give lines, texts, dimensions, patterns and macros a Z coordinate.
The Z coordinate is only used so far for drawing and printing Fill (color) type hatches (G4, BD, G4 Plant).
-
A larger Z coordinate hatch covers a smaller Z coordinate hatch.
-
Vertex ED (Electrical Design) has features that allow you to filter elements from the drawing, such as PDF printing, based on the Z coordinate.
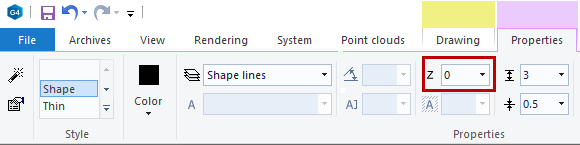
The drawing plane consists of X and Y coordinates. The Z coordinate increases from the drawing plane towards the viewer.